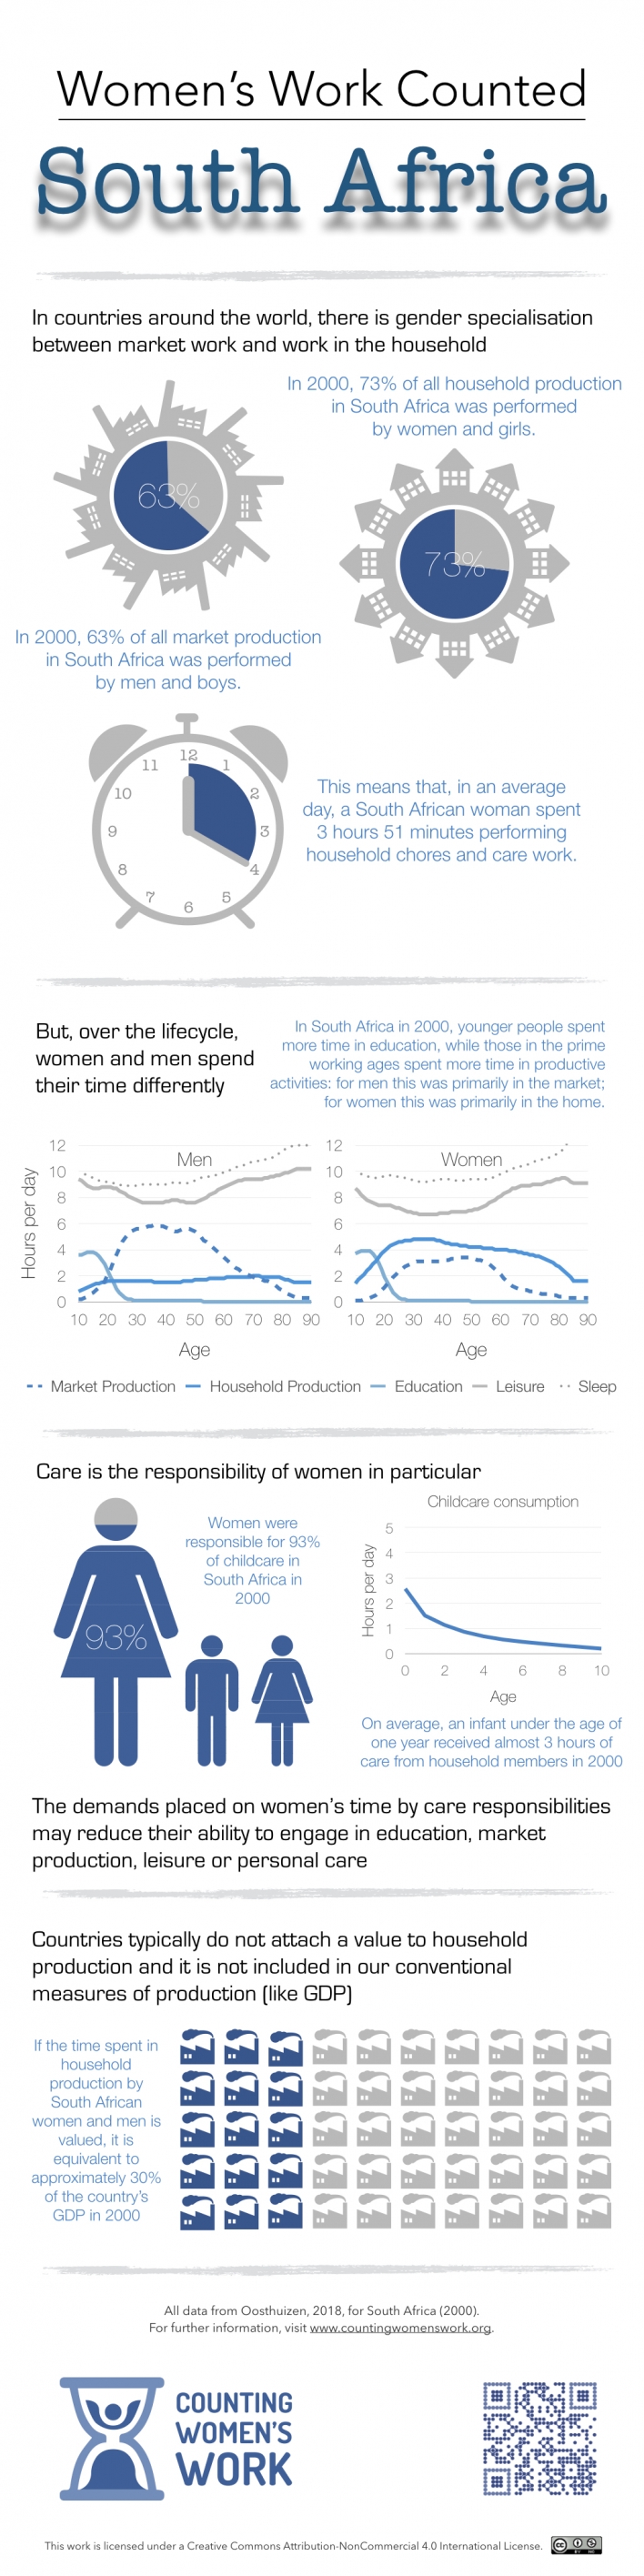
Infographic, South Africa 2000
Counting Women’s Work estimates of the market and unpaid care work economies can be summarized with a series of statistics. CWW produces infographics to show these results. Infographics are available with a dark or light background. The infographic for South Africa’s 2000 results is shown below. Results from 2010 were published previously and can be found here.
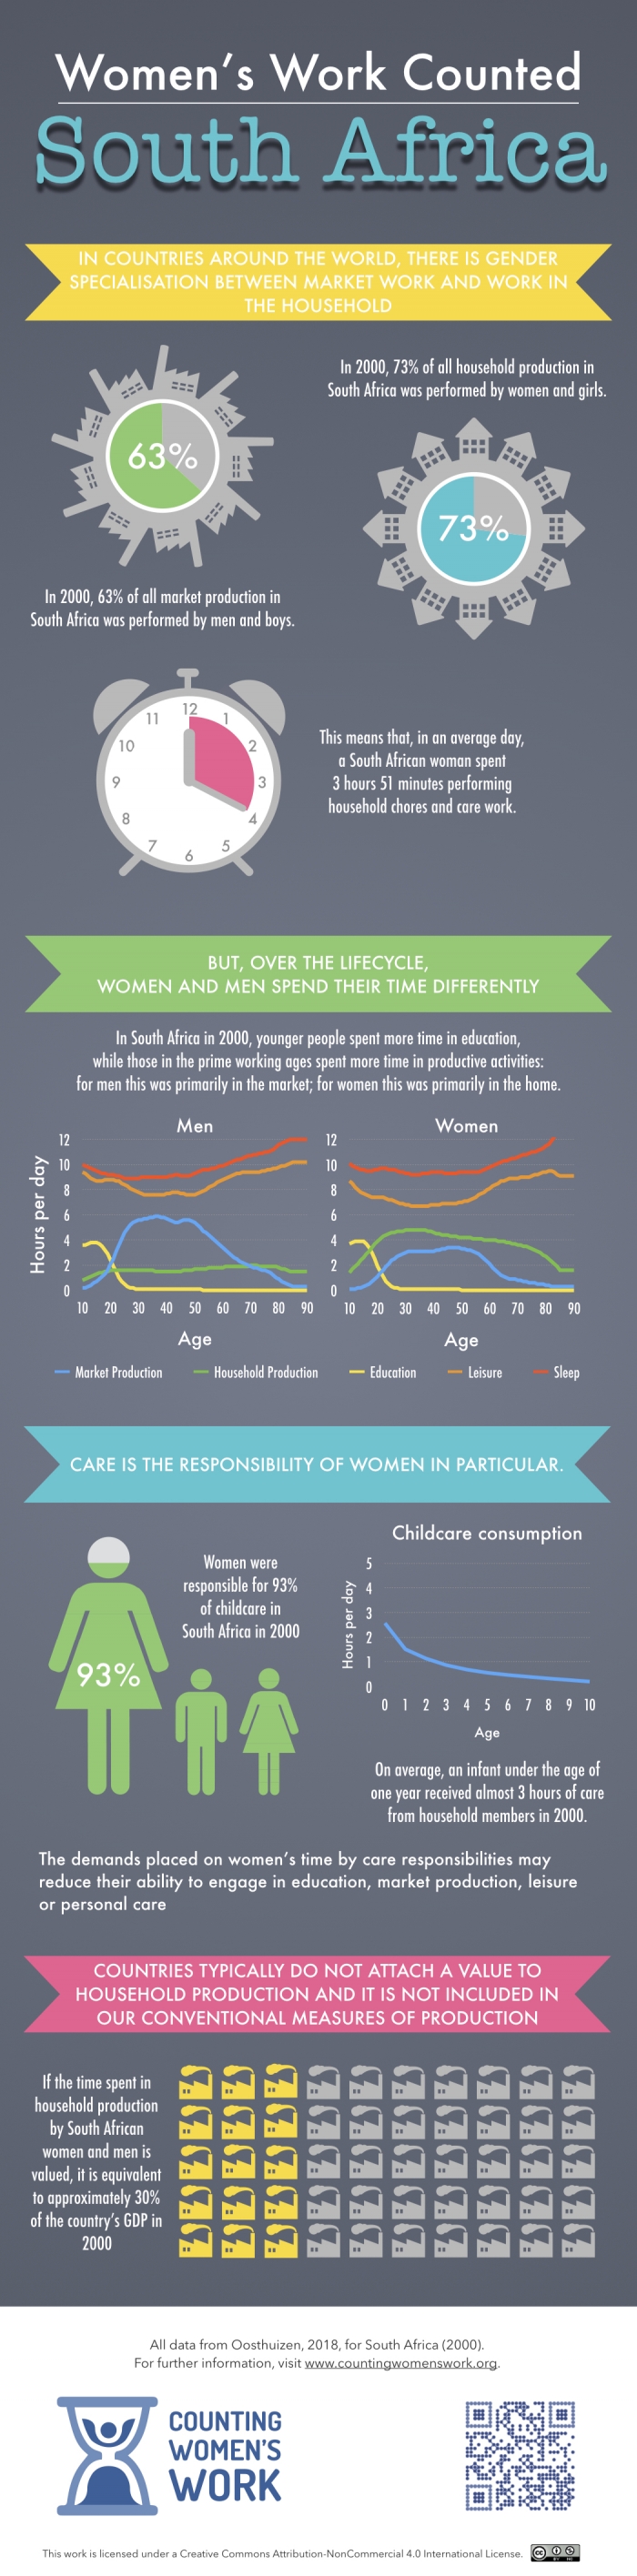
All infographics are licensed under a Creative Commons Attribution-NonCommercial 4.0 International License.